
2011 Climate Change Index
How is the index calculated?
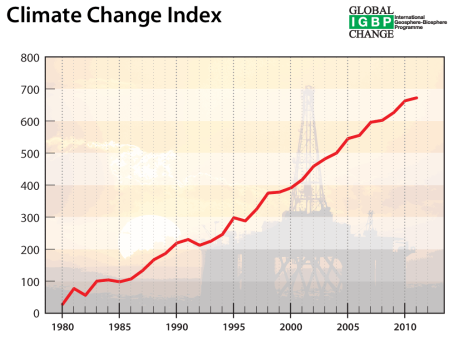
The reference point is 1980 - the earliest date the index has been calculated. The annual change of each parameter (carbon dioxide, sea level, temperature, Arctic sea-ice minimum) is normalised (between 1980 and 2007). Zero is no annual change. One hundred is the maximum-recorded annual change between 1980 and 2007. Minus one hundred is the minimum change between 1980 and 2007.
Each year, we take the average of the normalised parameters. This gives the index for the year. The value of the index for each year is added to that of the previous year to show the cumulative effect of annual change.
The Climate Change Index is in development and subject to review.

ftp://ftp.cmdl.noaa.gov/ccg/co2/trends/co2_annmean_mlo.txt
Reference: Dr. Pieter Tans, NOAA/ESRL (www.esrl.noaa.gov/gmd/ccgg/trends/) and Dr. Ralph Keeling, Scripps Institution of Oceanography (scrippsco2.ucsd.edu/)

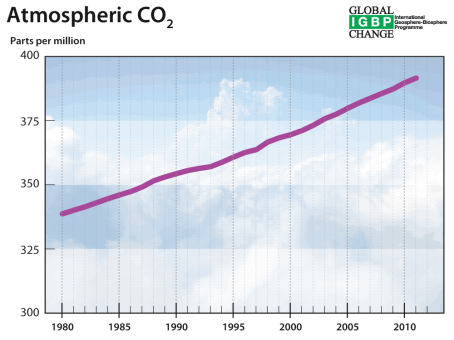
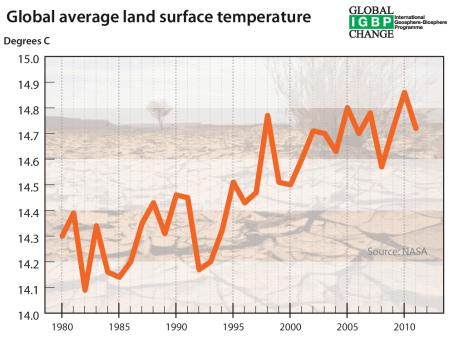
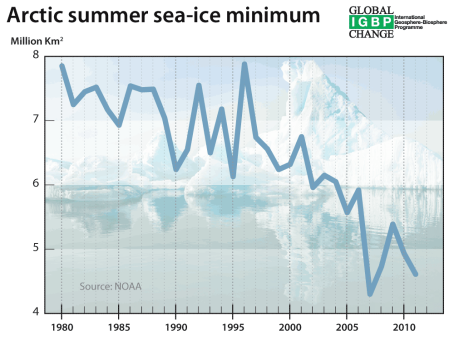
Climate-change index from 1980, including cumulative change
| Global land surface temp. anomaly | Atmos. CO2 | N. hemis. minimum sea ice extent | Sea level | Climate Index | Climate Index Cumulative | |
|---|---|---|---|---|---|---|
| Year | Degrees C | ppm | mill km2 | mm | ||
| 1980 | 14.30 | 338.68 | 7.85 | 142.20 | 28 | 28 |
| 1981 | 14.39 | 340.10 | 7.25 | 154.60 | 49 | 77 |
| 1982 | 14.09 | 341.44 | 7.45 | 148.90 | -21 | 56 |
| 1983 | 14.34 | 343.03 | 7.52 | 157.30 | 44 | 100 |
| 1984 | 14.16 | 344.58 | 7.17 | 156.30 | 4 | 104 |
| 1985 | 14.14 | 346.04 | 6.93 | 146.00 | -6 | 98 |
| 1986 | 14.20 | 347.39 | 7.54 | 146.70 | 9 | 107 |
| 1987 | 14.35 | 349.16 | 7.48 | 147.30 | 26 | 133 |
| 1988 | 14.43 | 351.56 | 7.49 | 152.00 | 34 | 167 |
| 1989 | 14.31 | 353.07 | 7.04 | 156.40 | 19 | 186 |
| 1990 | 14.46 | 354.35 | 6.24 | 157.80 | 33 | 219 |
| 1991 | 14.45 | 355.57 | 6.55 | 160.90 | 12 | 230 |
| 1992 | 14.17 | 356.38 | 7.55 | 163.70 | -18 | 212 |
| 1993 | 14.2 | 357.07 | 6.50 | 159.33 | 12 | 225 |
| 1994 | 14.32 | 358.82 | 7.18 | 163.18 | 21 | 246 |
| 1995 | 14.51 | 360.80 | 6.13 | 168.76 | 52 | 298 |
| 1996 | 14.43 | 362.59 | 7.88 | 169.86 | -10 | 288 |
| 1997 | 14.47 | 363.71 | 6.74 | 175.45 | 37 | 325 |
| 1998 | 14.77 | 366.65 | 6.56 | 177.75 | 50 | 375 |
| 1999 | 14.51 | 368.33 | 6.24 | 178.38 | 3 | 378 |
| 2000 | 14.50 | 369.52 | 6.32 | 180.73 | 13 | 391 |
| 2001 | 14.60 | 371.13 | 6.75 | 186.91 | 26 | 417 |
| 2002 | 14.71 | 373.22 | 5.96 | 190.83 | 42 | 459 |
| 2003 | 14.70 | 375.77 | 6.15 | 193.39 | 23 | 482 |
| 2004 | 14.63 | 377.49 | 6.05 | 196.85 | 18 | 500 |
| 2005 | 14.80 | 379.80 | 5.57 | 201.61 | 45 | 545 |
| 2006 | 14.70 | 381.90 | 5.92 | 203.34 | 10 | 555 |
| 2007 | 14.78 | 383.77 | 4.30 | 203.71 | 42 | 596 |
| 2008 | 14.57 | 385.59 | 4.73 | 208.37 | 6 | 602 |
| 2009 | 14.72 | 387.38 | 5.39 | 212.42 | 24 | 626 |
| 2010 | 14.86 | 389.78 | 4.93 | 213.75 | 37 | 663 |
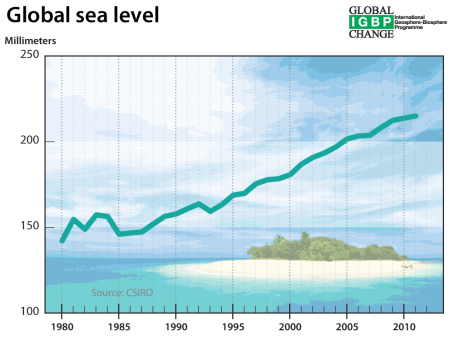
| 2011 | 14.72 | 391.57 | 4.61 | 215.00 | 10 | 672 |
Data
Global Temperature Anomaly
Data - NASA Goddard Institute for Space Studies
http://data.giss.nasa.gov/gistemp/tabledata/GLB.Ts.txt
(Downloaded 25 January 2012)
Carbon dioxide
Data Carbon Dioxide Information Analysis Center (CDIAC)
ftp://ftp.cmdl.noaa.gov/ccg/co2/trends/co2_annmean_mlo.txt
Ref: Dr. Pieter Tans, NOAA/ESRL (www.esrl.noaa.gov/gmd/ccgg/trends/) and Dr. Ralph Keeling, Scripps Institution of Oceanography (scrippsco2.ucsd.edu/)
(Downloaded 25 January 2012)
Sea level
Data - Church and White Global Mean Sea Level Reconstruction
Proudman Oceanographic Laboratory
http://www.cmar.csiro.au/sealevel/sl_data_cmar.html
(Downloaded 23 February 2012)
Sea ice (Arctic minimum)
Data - National Snow and Ice Center (Boulder Colorado)
ftp://sidads.colorado.edu/DATASETS/NOAA/G02135/Sep/N_09_area.txt
(Downloaded 25 January 2012)
Two-minute film about the index
Watch a short film that explains the index.


